Geopolitical Upheaval, End of QE2 Increase Stock Market Correction Risk
Upheaval in the Middle East/North Africa region has sent oil prices surging above $100 and caused the first significant U.S. stock market pullback since November. Thus far, the correction has been a modest 3% peak-to-trough, and this remains one of the longest running rallies in the S&P 500 without a 5% correction. That streak appears vulnerable, however, and this would certainly appear to be a time to be patient about taking on additional risk in portfolios. In the event of a deeper correction, the first area of support for the S&P 500 comes in at 1275-1290, with major support at 1225-1240.
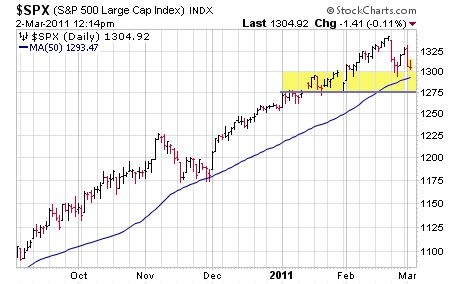
The situation in the Middle East and North Africa is obviously unpredictable. Markets can be expected to remain volatile and will react quickly to developments. No one can foresee how many countries will be engulfed by unrest and rebellion, or the degree to which the global oil supply will be threatened. The risk of sharply higher oil prices (e.g. $125 or higher) – which could derail the global economic recovery - is sufficiently elevated to warrant caution with respect to new long positions in the stock market. It is unsettling that the Saudi stock index has dropped 17% in past two weeks, given that Saudi Arabia holds 20% of the world’s oil. Exhibit 1 2
Ultra-Loose U.S. Monetary and Fiscal Policy is Approaching an End
Apart from the geopolitical backdrop, there are additional reasons to be cautious at this juncture.
Unprecedented monetary and fiscal policies have created an economic recovery that is artificial to an indeterminate degree. Similarly, the massive rally in the stock market of the past two years has been built to an uncomfortably large extent on the shaky ground of extraordinary government intervention in the form of $1.5 trillion annual fiscal deficits and over $2 trillion of Federal Reserve asset purchase programs. Aside from job creation, which has been consistently disappointing, U.S. economic data have generally surprised on the upside over the past several months, but how the economy performs once stimulus begins to be withdrawn after the second quarter is an open question.
“Quantitative Easing” Set to End June 30
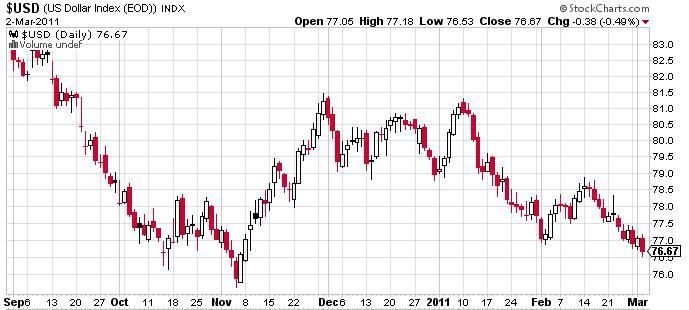
There has obviously been a strong correlation between the Federal Reserve’s quantitative easing programs and the performance of the financial markets. The 25% rally in the S&P 500 over the past six months commenced when Bernanke announced his intentions for a second round of market intervention through quantitative easing. The Fed has lubricated markets with $80 billion per month of Treasury bond purchases using newly printed money. This monetization program expires June 30, and in all likelihood will not be extended. Inflation pressures are simply too high for even Bernanke to justify continuing with such an unorthodox and overtly inflationary program (see Exhibits 2 and 3).
Exhibit 2: Commodity Prices Clearly Reflect Growing Inflationary Pressures
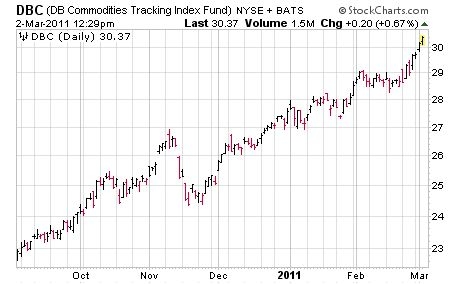
Exhibit 3: U.S. Dollar Down Nearly 8% Since QE2 Announced
Quantitative easing has affected all financial markets – stocks, currencies, commodities, and bonds. Nearly 70% of the annualized issuance of Treasury bonds since the beginning of QE2 has been purchased by the Fed, which raises the question - who will buy Treasuries at current yields when the Fed doesn’t? Investors should be apprehensive about the consequences of the June 30 expiration of QE2. It remains to be seen what effect the end of quantitative easing will have on the financial markets, and when markets will begin to discount the withdrawal of this extraordinary stimulus, which amounts to $1.5 trillion on an annualized basis.
Fiscal Restraint is Coming, Albeit Slowly
Although it is early stages, we are clearly seeing a welcome new trend in the county towards restoring some fiscal sanity. Retrenchment has begun in state government spending, whose new budgets go into effect in July. States used an estimated $150 billion in federal stimulus money to plug budget holes over the past two years. Now that money is gone, and states must balance their budgets. In the U.S. Congress, we see the beginnings of a movement towards fiscal restraint. Increasing public and media attention on the ballooning debt and the looming fiscal crisis indicates that fiscal restraint at the federal level is coming; the only question is over timing. The current federal budget, with its $1.6 trillion deficit, runs through October 2011. On February 14th, President Obama sent Congress a fiscal 2012 budget, which proposed a $1.1 trillion deficit. Obama’s budget was a disappointment; he didn’t follow any of the recommendations of his own debt commission, and proposed nothing to deal with the country’s unsustainable structural deficit. The GOP assailed the President’s budget, but has yet to propose meaningful spending cuts to the significant components of the budget - entitlement programs, transfer payments, and defense spending. It remains to be seen what sort of federal budget will be enacted for fiscal 2012, and how any proposed spending cuts will affect the economy and the markets.
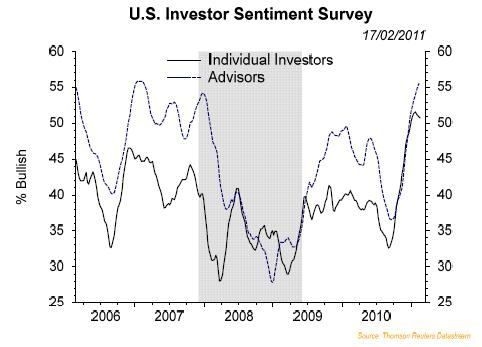
Investor Sentiment Appears Overly Bullish Given Macroeconomic and Geopolitical Risks
Bullish sentiment has come to dominate both individual investors and advisors, as depicted in Exhibit 4. Optimism in particularly concentrated in professional circles. According to recent Bank of America/Merrill Lynch Fund Manager Survey, 67% of asset managers were overweight global equities, the highest level in the 10 year history of the survey.
Exhibit 4: Bullishness Back to 2007 Levels
The implication of current bullish sentiment readings is that investors have drawn down their cash reserves and built up their exposure to risk assets. In fact, that is exactly what has occurred. Individual investors are holding nearrecord low levels of cash. It is not hard to understand why given negative “real” short-term interest rates. Currently, there are 2.7 times more assets in stocks than money market funds (see Exhibit 5). This ratio is the highest since late 2007, and 2000, when the ratio was over 3.0. The ratio has followed the market itself very closely over the years, with 3.0 being the high extreme and 1.2 or so marking the lower boundary.
Exhibit 5: Stock Fund Assets as a Multiple of Money Market Assets
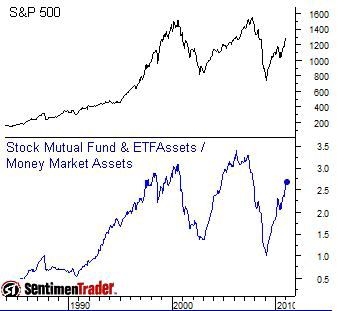
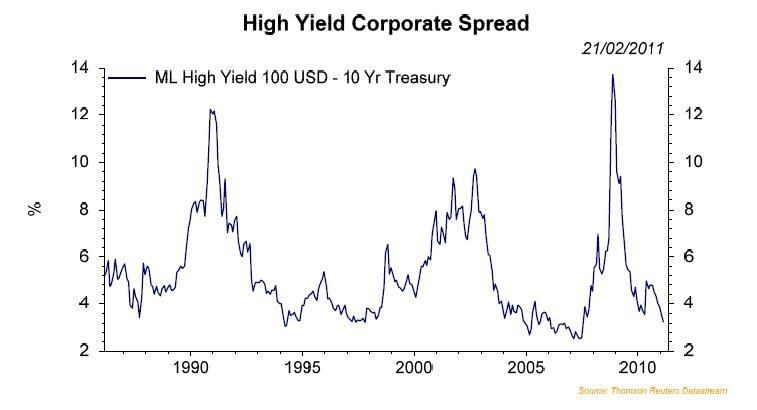
It is conceivable that this ratio of stock fund assets to money market fund assets will exceed historical boundaries, given the unprecedented zero percent interest rate environment. With cash earning next to nothing, and government bonds such as U.S. Treasuries also seeming to offer poor return prospects, what other choice do investors have to generate returns than to go up the risk spectrum, or engage in market timing? The junk bond market, where yields recently dipped below the all-time low of 6.81%, provides a clear illustration of investors’ hunt for yield, and the degree to which Fed policy is suppressing expected returns across the spectrum of asset classes.
Exhibit 6: No Margin of Safety in Junk Bonds
Low Volatility Advance Likely Over
Stocks and other risk assets have been in a low volatility advance for the past six months. Our sense is that is about to change, and markets are entering a higher volatility phase. Given the geopolitical backdrop, the withdrawal of monetary and fiscal stimulus that is coming after the current quarter, and an investor sentiment backdrop that looks awfully complacent, we recommend caution and patience with respect to new positions in risk assets. A lot of the good news and optimism with respect to economic and earnings growth are already built into stock prices. Stocks are overvalued based on trend-line earnings, but are not at extreme levels. Valuations are certainly capable of moving higher, particularly against a backdrop of negative real interest rates, which will most likely remain in place for the balance of 2011.
Although QE2 will expire in four months, Bernanke seems determined to ignore commodity inflation and stick with an ultra-loose monetary policy. This remains an unusually challenging investment environment, with a very wide range of potential outcomes. Anyone who has a strong opinion of precisely how events will play out in the markets in the months ahead does not really understand the complexity of the situation. Against this backdrop, flexibility to adjust to changing conditions is essential. Our best guess is that the stock market will have an overdue correction of 5-7% over the next several weeks, followed by another leg to the upside in the second quarter to perhaps 1400 on the S&P 500, which could mark the high for the year.
Gold Successfully Tests Long-Term Trendline
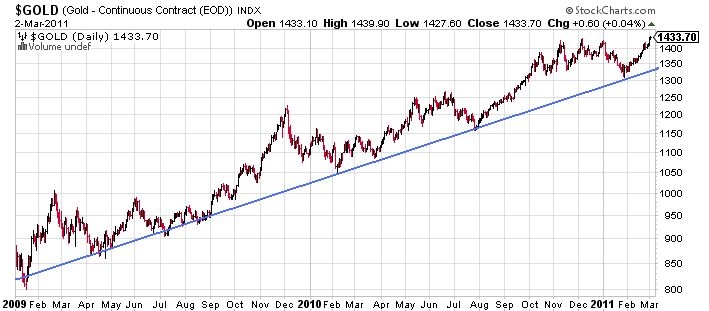
Gold recouped its January losses in February and yesterday made a new all-time high near $1440/ounce after rising for eight consecutive sessions, buoyed by safe haven buying on geopolitical and inflation fears (Exhibit 7). Gold bounced off support from a trendline extending back to January 2009 (Exhibit 8).
Exhibit 7
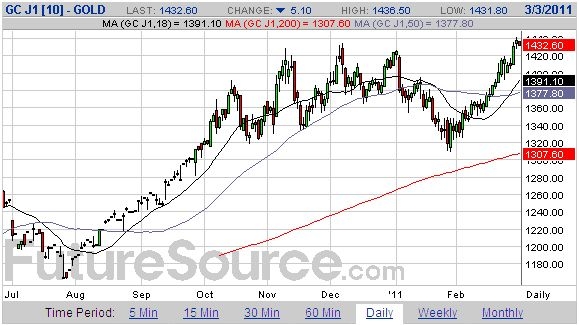
Despite gold’s recent strength, we would advise caution with new gold purchases at these levels. Geopolitical instability is a wildcard with respect to gold, but the withdrawal of U.S. monetary and fiscal stimulus later in 2011, as well as monetary tightening in emerging markets, should pose a headwind to gold prices. Investors should bear in mind that gold has risen for ten years in succession, and was up 29% in 2010 and 24% in 2009. Our best guess is that gold will fluctuate over the balance of 2011 between $1250 and $1500.
Exhibit 8


No comments:
Post a Comment